PACS2 drug repurposing pilot screen
A pilot screen of 1,411 compounds revealed 25 compounds that rescue Cell Painting phenotypes in PACS2 fibroblasts, including a hit that makes diseased cells look indistinguishable from healthy cells.
In collaboration with
A picture is worth a thousand assays. That’s the guiding principle of Cell Painting, an image-based screening approach for assessing the physiological state of the cell. In theory, any cell grown in culture can be treated with five vital stains and illuminated under the microscope. If you’re tuning into the PACS2 cure odyssey for the first time, you might want to review this project update from the Spring. Otherwise this highlight reel of a field of wildtype fibroblasts showing off their nuclei, ER, nucleoli and cytoplasmic RNA, Golgi and plasma membrane, and last but not least mitochondria, will serve as a quick refresher.
Cell Painting was first developed at the Broad Institute by Dr Anne Carpenter’s group in 2013, and version 3 was published earlier this year. Recursion Pharmaceuticals was founded almost a decade ago on the premise of industrializing Cell Painting as a platform technology with the help of computer vision and machine learning. The company’s two most advanced programs in Phase 1/2 clinical trials are both repurposed drugs that were identified in Cell Painting screens, so there’s no arguing about the translational value of the approach.
When alternative patient avatars, e.g., iPSCs, are more exploratory or simply too expensive, skin cells aka fibroblasts are a great option that preserves the genetic background of the patient while obviating the cost and time to install a causative pathogenic variant in a generic cell line. An allelic series and isogenic corrected control line have their place especially when the mechanism of inheritance is unknown, i.e., loss-of-function versus gain-of-function, or there are strongly suspected disease modifiers afoot. So long as those complicating factors are not in play, the minimum viable path for drug repurposing is a primary fibroblast line, which can be thought of as the simplest possible human-derived patient avatar.
Since we last checked in five months ago, a team of drug hunters at a CRO was hard at work optimizing Cell Painting for use on a PACS2 patient fibroblast line. For traditionalists that prefer assays that measure the activity of a particular cellular process or protein in what is thought to be the most relevant cell type, the knock against Cell Painting is that it’s “not specific enough.” However, for a multifunctional but incompletely characterized protein like PACS2 that literally sits at the crossroads of the ER and mitochondria, Cell Painting is actually a sensible bundle of assays that balances the tradeoff between biased and unbiased drug screening approaches.
Obviously it’s not possible to model all aspects of human physiology in a fibroblast line growing on a plastic dish in the lab, let alone map cell morphology features observed in fibroblasts to symptoms or specific disease processes in human beings living with PACS2 E209K. For example, the intensity of one of the Cell Painting dyes as a function of cell area is higher in the age-matched and sex-matched wildtype control line compared to the diseased cell line.
Now what if we told you there are dozens of such features that visually distinguish healthy versus diseased cells? Will rescuing most or all of those features translate to clinical benefit? No one knows the answers to those questions. All research is a calculated risk. More often than not, scientists talk themselves out of doing or get talked out of doing what turns out in retrospect to a be a low-risk, high-reward experiment. PACS2 Research Foundation and its advisors have proceeded thoughtfully yet assertively at every step of the process. They were rewarded last month with promising pilot screen data.
For the sake of brevity, assay development and assay benchmarking experiments that preceded the pilot screen will be condensed into a series of quality control figures below. Two batches of cells were grown so there are two biological replicates. No plate effects are observed. The coefficient of variation (%CV) was below the 20% cutoff in every condition except the healthy control fibroblasts stained with MitoTracker.
The dozens of Cell Painting features mentioned above are shown summarized in these plots. A machine learning model was trained on images of healthy cells. Diseased cells treated with drugs were classified as either healthy (rescue effect) or diseased (no effect). When this operation is performed across a population of hundreds of cells, the percentage of healthy versus diseased cells can be calculated.
Those plots are derived from images of cells. The effects are too subtle for the human eye but are eminently perceptible to the machines. The top row is a field of healthy control cells. The middle row is a field of diseased PACS2 cells. The bottom row is a field of diseased cells treated with a compound that rescues Cell Painting features across the board.
When you aggregate all the data across all of those features and all those cells, you end up with a heap of information. Principal Component Analysis (PCA) is a dimensionality-reducing technique that condenses the variance in a dataset into discretized principal components. Over 85% of the variance in the PACS2 Cell Painting pilot screen is captured in the first three principal components.
You can see below that PACS2 fibroblasts and wildtype fibroblasts occupy different regions of PCA space, with a disease modifying chasm in between. Can a small molecule drug move PACS2 cells in PCA space closer to, or even smack dab in the center of, the healthy cells?
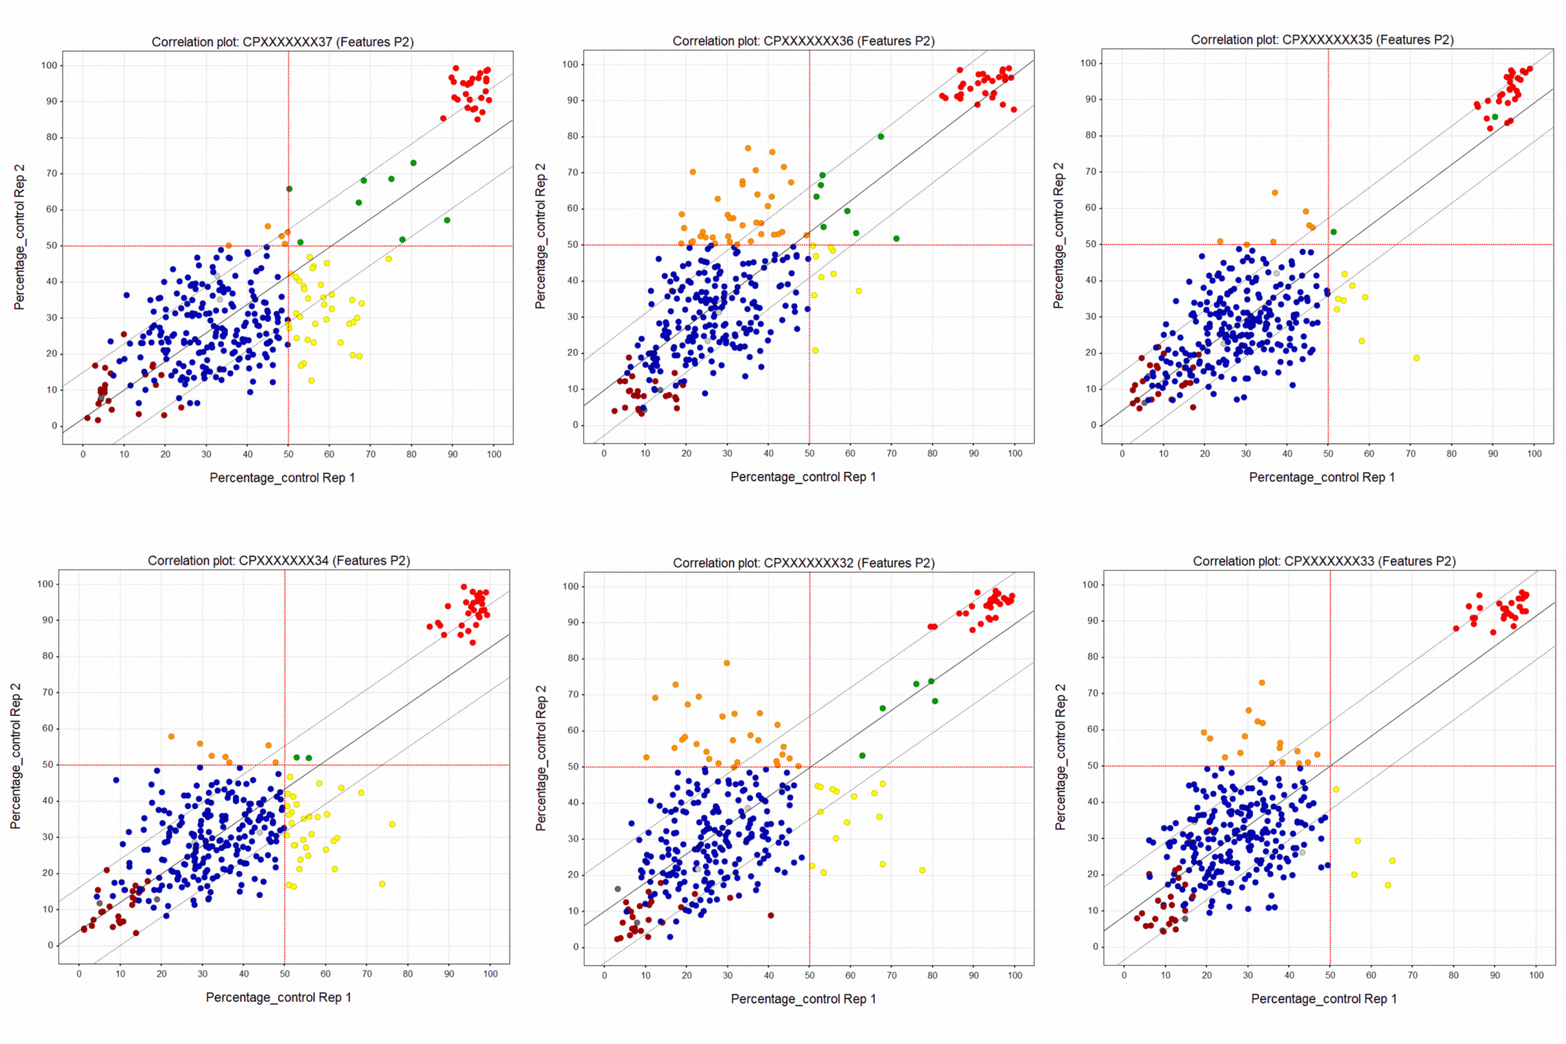
Here’s a summary of the 1,411-compound pilot screen of the Prestwick and SelleckChem libraries. The dark blue points are inactive wells. The bright red points at the top are the healthy control line. The crimson points at the bottom are the diseased PACS2 line. The yellow points are active wells only in replicate 1. The orange points are active wells only in replicate 2. The green points are active wells in both replicates 1 & 2. A liquid dispensing artifact causes the horizontal laddering pattern. Even so, there is clear separation between negative and positive control wells.
As already noted, the green points are compounds that restored greater than half of the diseased cells in a well to a healthy-cell appearance in both replicates. In fact there are 25 hits that rescue above the 50% cutoff. That means the pilot screen worked! After PCA assessment, eight (8) hits were identified that shift the morphology of diseased cells towards the morphology of healthy cells. The hits can be tentatively grouped into five presumed mechanisms of action, which is all we can say with certainty at the moment.
There are also clearly a fair number of replicate-specific hits, indicating intrinsic biological variability also seen in Professor Nicoleta Moisoi’s workup of patient fibroblasts for Project 8p Foundation.
In spite of that variability, the pilot screen revealed a compound that made 90% of diseased cells appear healthy. It’s the lone green point in the positive control cloud of red points. Additional testing of the hits — potency screening — is required to confirm their ability to shift diseased-cell morphology towards healthy-cell morphology.
PACS2 Research Foundation is close to making a final decision about advancing to a full screen of the ~5,000-compound Broad Repurposing Hub library (aka SPECS). Stay tuned..


