PGAP3 ReFRAME recap
We completed hit calling last week and we'll perform validation experiments on the top 1% hits later this month. ~13,500 unique compounds were tested - our largest drug multipurposing screen to date.
In the last project update, we shared raw screening data hot off the presses. Here we share normalized Z scores and our hit calling analysis. Out of nearly 13,500 compounds, we identified seven strong hits. Sometime later this month we’ll test the top 1% of ReFRAME hits in dose-response plates as part of hit validation.
Collaborators
Due to operational considerations at SMDC, we screened the ReFRAME library —52 384-well plates in total — in three batches. The mean growth of the first batch is higher than the next two batches but assay performance improved from one batch to the next.
Normalization to the rescue!
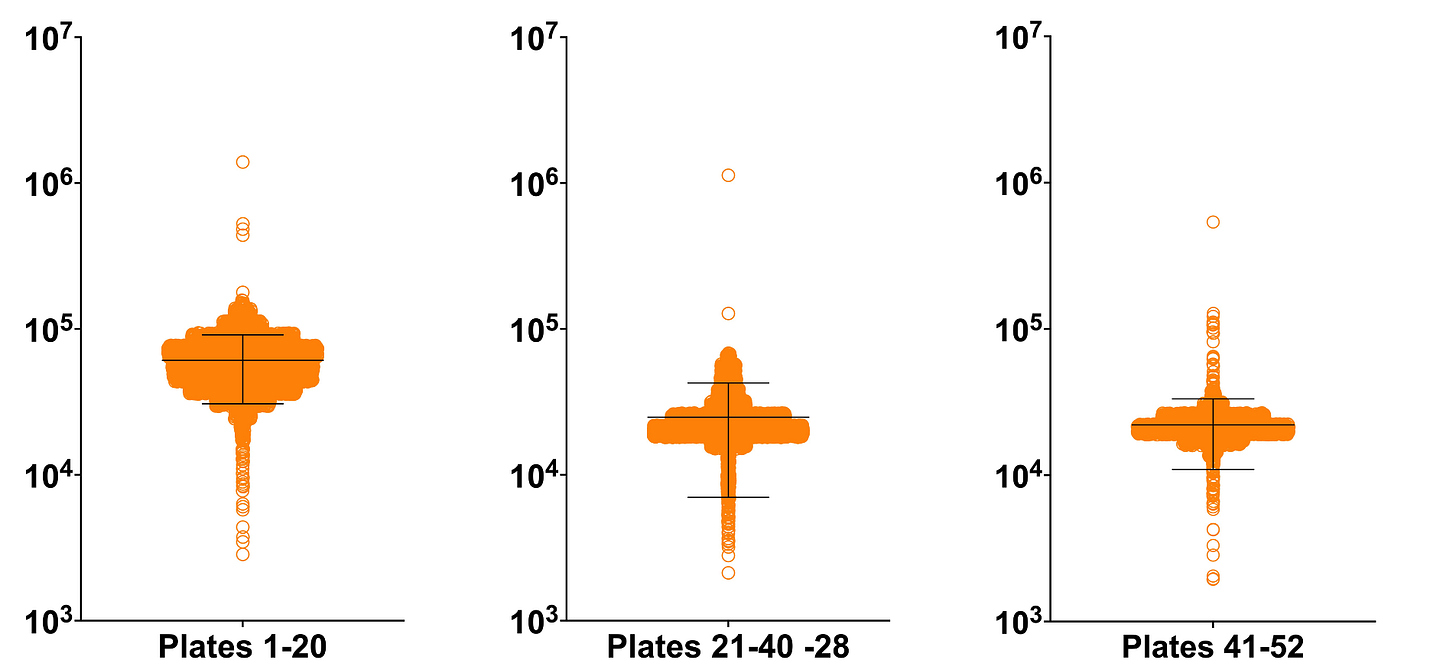
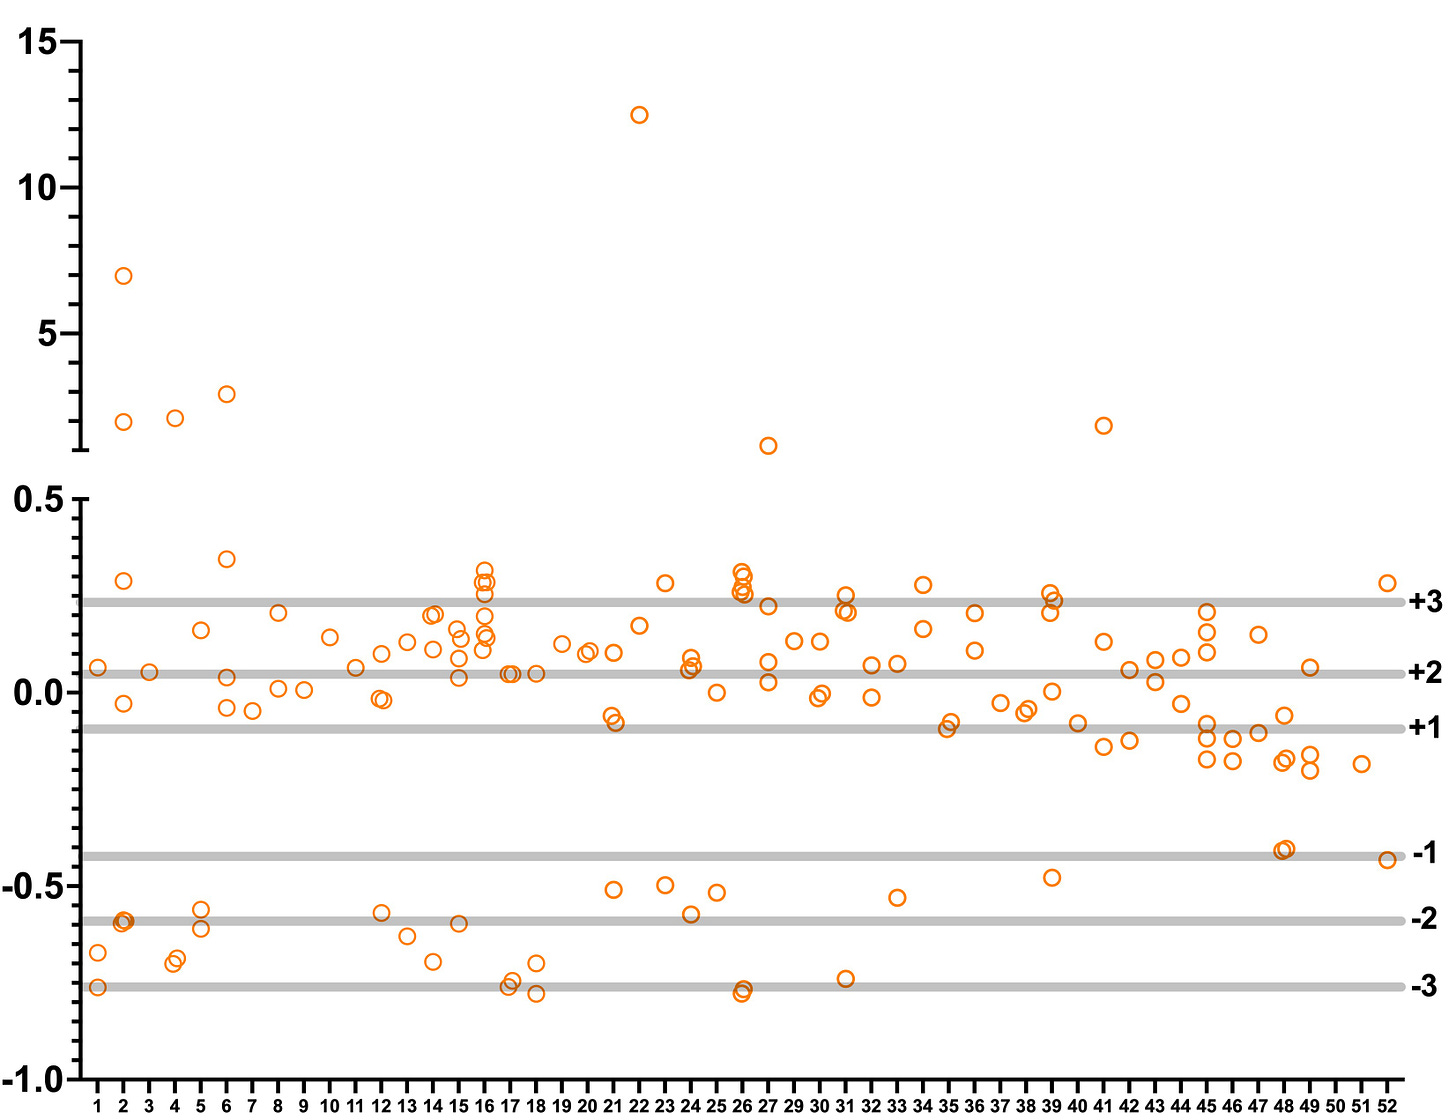
In the figure below, the complete unnormalized dataset is plotted on the left. As shown in the center plot, per-plate normalization corrected for position effects and the difference between the mean of the first batch and the means of the second and third batches. The top 1% of hits is plotted on the right. The horizontal gray lines indicate standard deviations above or below the mean.
Applying a strict threshold of 2.5 standard deviations above (or below) the mean yielded ~100 hits split 70/30 between suppressors (rescue of the growth defect) and enhancers (worsening of the growth defect).
However, upon manual inspection of each plate to confirm hits, three plates had position effects that created higher variance of measurements across the plate, and therefore what appeared to be spurious hits aka false positives.
As will become clear when data from individual plates is plotted, manual hit calling was required to prune hits from three higher variance plates. At the same time, manual hit calling was also required to select plate winners (and losers) that did not exceed the threshold of 2 standard deviations above (or below) the mean. This was especially true for plates in the third batch.
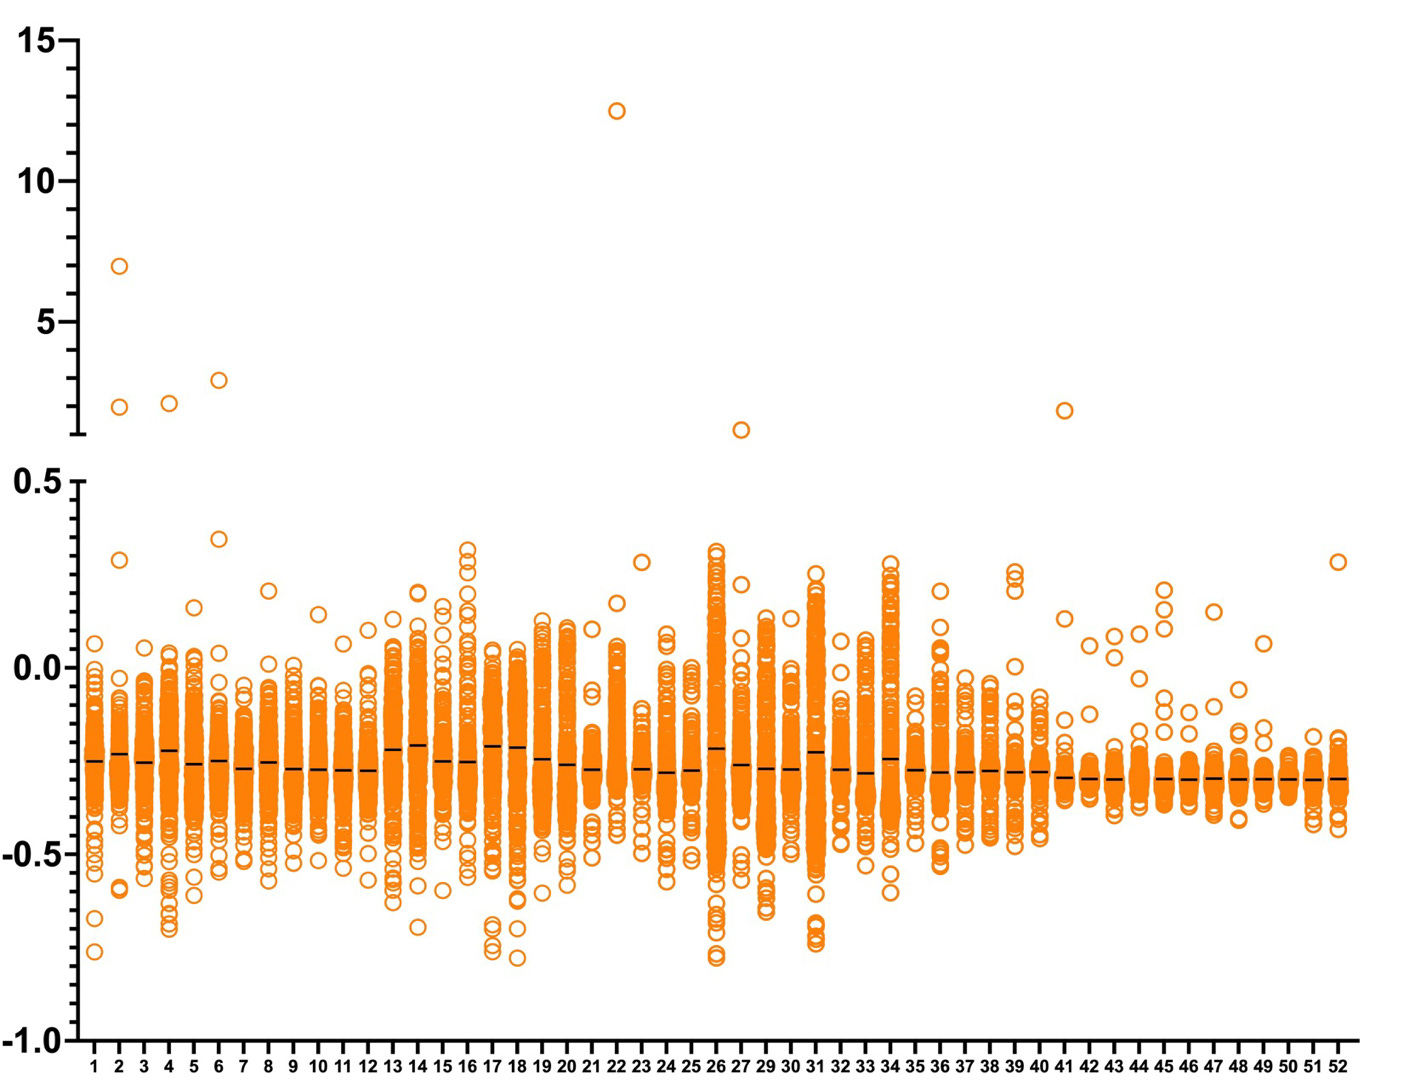
In a series of histograms below, the yeast PGAP3 ReFRAME dataset is plotted with each 384-well library plate and its ~280 test compounds as a column. Plate means are indicated by the black dashes. Here are the unnormalized raw data:
Next we generated a histogram of the normalized Z scores. More “weak” hits are observed in plates 41-52 which required manual hit selection. Plates 26, 31 and 34 have the highest variance and so required manual hit pruning, or de-selection.
In the final step of hit calling, we automatically considered a compound a hit if its Z score is two standard deviations above or below the mean (with the exception of the aforementioned higher variance plates).
We also considered plate winners and losers that separated themselves from the statistical pack by at least one standard deviation. The exceptions were plate winning hits that were manually selected from plates 41 to 52.
Here’s an example of a plate that contains a strong, moderate and weak hit. Unnormalized data are plotted on the left; Z scores are plotted on the right.
Here’s the plate that contained the hit with the highest Z score in the dataset: 12.5.
Here’s one of the three higher variance plates:
Here’s a typical plate with no hits or plate winners or losers.
We’ll post the next update after we complete the dose-response hit validation experiments. We’re hoping to have results to present by Rare Disease Day 2023.
Stay tuned!


